Usage Guide
Learn how to run captures, filter traffic, and make the most of ptcpdump’s process-aware metadata.
Core Invocation
List the available interfaces and start a capture:
sudo ptcpdump -D
sudo ptcpdump -i eth0 -c 20
ptcpdump accepts the same filter syntax as tcpdump. For example:
sudo ptcpdump -i any 'tcp port 443 and host 139.178.84.217'
Command Examples
sudo ptcpdump -i eth0 tcp
sudo ptcpdump -i eth0 -A -s 0 -n -v 'tcp and port 80 and host 10.10.1.1'
sudo ptcpdump -i any -s 0 -n -v -C 100MB -W 3 -w test.pcapng 'tcp and port 80 and host 10.10.1.1'
sudo ptcpdump -i eth0 'tcp[tcpflags] & (tcp-syn|tcp-fin) != 0'
Additional patterns:
sudo ptcpdump -i eth0 -i lo
sudo ptcpdump -i any --uid 1000
sudo ptcpdump -i any -w - port 80 | tcpdump -n -r -
sudo ptcpdump -i lo --netns /run/netns/foo --netns /run/netns/bar
Choosing a Backend
ptcpdump defaults to the tc backend, but you can select other eBPF attachment points depending on your environment. For example, to capture using the cgroup socket hook:
sudo ptcpdump -i any --backend cgroup-skb host 1.1.1.1
Each backend has trade-offs around layer-2 visibility and namespace support. Head over to the Backend Guide for a comparison table and more examples drawn from the README.
Process and Container Filters
Focus on specific workloads using the extra context-aware flags:
sudo ptcpdump -i any --pid 1234 --pid 5678
sudo ptcpdump -i any --pname curl
sudo ptcpdump -i any --container-id 36f0310403b1
sudo ptcpdump -i any --pod-name web.default
To capture traffic generated by a command, let ptcpdump launch it directly:
sudo ptcpdump -i any -- curl https://example.com
Metadata-Rich Output
Verbose mode (-v) surfaces full process/container/pod metadata:
13:44:41.529003 eth0 In IP (tos 0x4, ttl 45, id 45428, offset 0, flags [DF], proto TCP (6), length 52)
    139.178.84.217.443 > 172.19.0.2.42606: Flags [.], cksum 0x5284, seq 3173118145, ack 1385712707, win 118, options [nop,nop,TS val 134560683 ecr 1627716996], length 0
    Process (pid 553587, cmd /usr/bin/wget, args wget kernel.org)
    ParentProc (pid 553296, cmd /bin/sh, args sh)
    Container (name test, id d9028334..., image docker.io/library/alpine:3.18)
    Pod (name test, namespace default, UID 9e4bc54b..., labels {"run":"test"})
Use --context to reduce the metadata you include:
sudo ptcpdump -i any -v --context=process --context=container
Saving Captures
Write packets to disk in PcapNG format with embedded metadata:
sudo ptcpdump -i any -w demo.pcapng
Read the capture back via tcpdump or tshark:
sudo ptcpdump -i any -w - 'tcp port 80' | tcpdump -n -r -
sudo ptcpdump -i any -w - 'tcp port 80' | tshark -r -
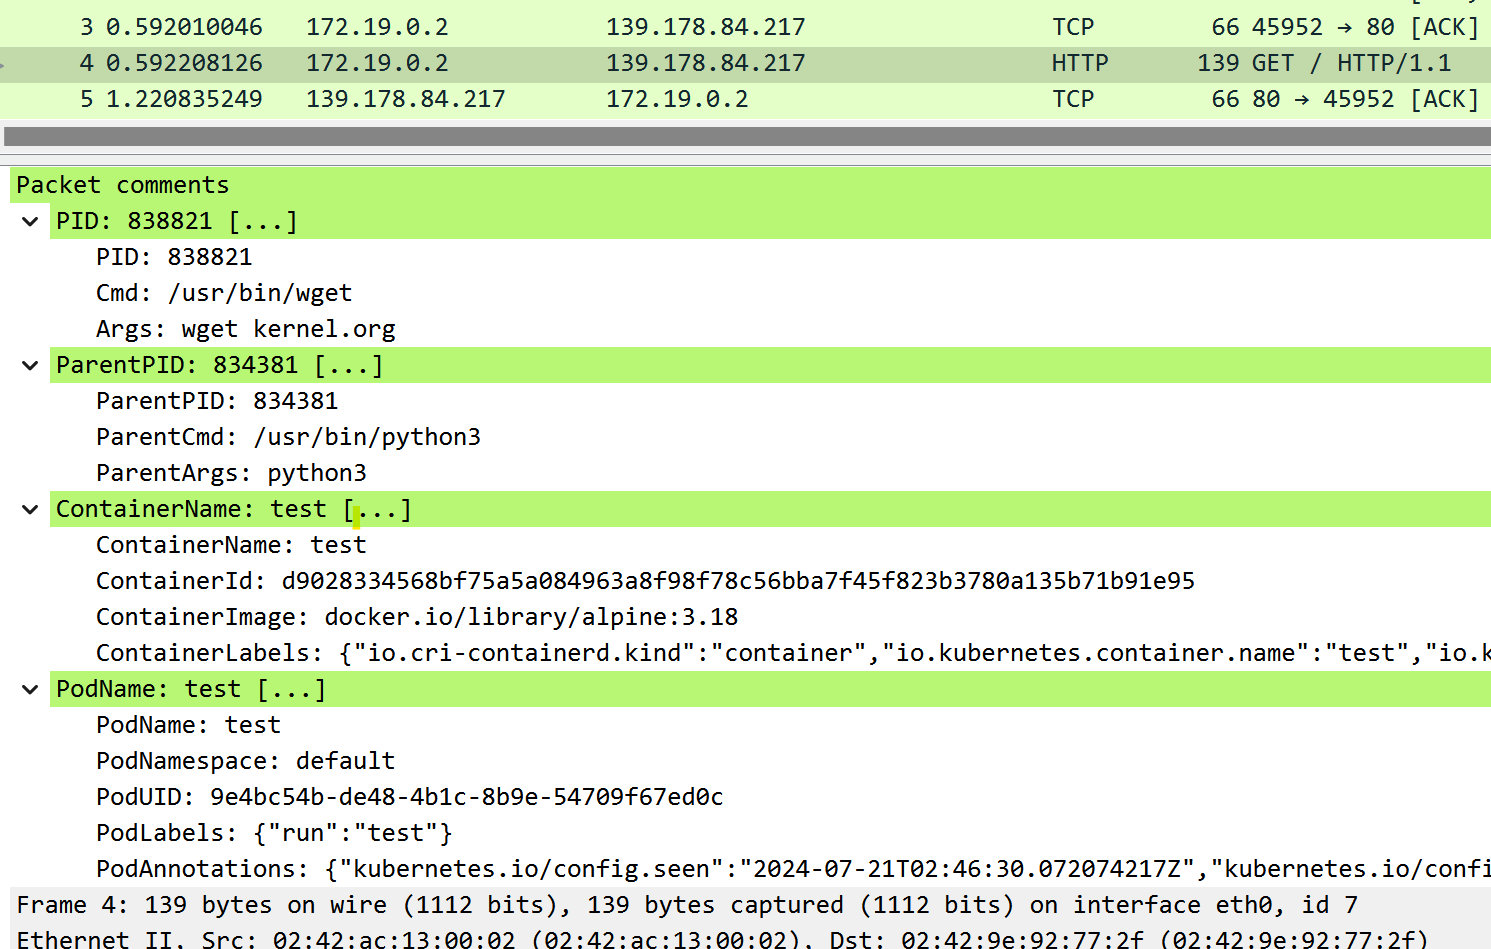
Working with Wireshark
Open the generated PcapNG files in Wireshark to inspect per-packet process details.
Rotation and Output Control
- Limit packet count:
-c 100 - Capture multiple interfaces:
-i eth0 -i lo - Rotate files:
-C 100 -W 3 -w capture.pcapng - Print ASCII payloads:
-Aor-X
For the full list of supported flags, run ptcpdump --help or consult the README flag matrix.